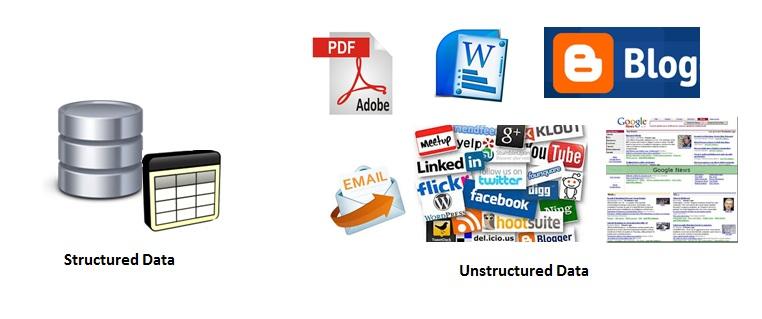
Wednesday, February 18, 2015

Data and Data Warehouse: Scope, Challenges, Future

Structured Data

Structured data refers to information with a high degree of organization which can be easily stored in a relational database which makes search simple and straightforward. It makes application of search engine algorithms and search operations simple and effective. Structured data has the advantage of being easily entered, stored, queried and analyzed, often using the Structured Query Language.
In other words data that resides in a fixed field within a record or file is called structured data. Implementing data warehousing in this type of data requires identifying the business process for which the data would be stored, and further identifying how the data will be stored, processed and analyzed. We need to define the tables and fields for which data will be stored, data types (numeric, currency, date), limitation on values. The relation between field and tables is defined which makes it easy to transform data into information.
Apart from tabular data, data in spreadsheets would be considered structured data, as it can be easily scanned for information and is properly arranged in relational database system.  An interesting point to note is about the XML files. The data in these files are not fixed in location or stored in databases but are still counted as structured, because the data are tagged and can be accurately identified.

Unstructured Data

Unstructured data is information that cannot be organized in a relational database and does not have a defined data model. It includes texts, emails and multimedia contents. Example of unstructured data would be audio files, videos, emails, pictures, web pages, and many business documents. The data generated through social media also falls under this category.  These data sources and files may have an internal structure but still it can be challenging to store such information in row-column basis, and thus it is classified under unstructured data.
The term ‘Big Data’ is often associated with unstructured data as it refers to extremely large data sets which require special tools to analyze the data. However, big data can include both structured and unstructured information.
http://saphanatutorial.com/wp-content/uploads/2014/01/Structured-and-Unstructured-Data.jpg
Structured data approximately contributes to 10%-20% data of an organization. It can be broadly classified into following data types:
Operational Data: This data supports the ongoing operations of an organization. This can include areas such as sales, service, manufacturing, billing, orders, accounts etc. It can be captured in Online Transaction Processing (OLTP) system as well as in OLAP (Online Analytical Processing) systems and is mostly numeric values for analysis and organizational decision making support. 
Master Data: Master data refers to persistent non-transactional data that can be used across multiple functional groups and defines key organizational entities. Master data may include data about customers, products, employees, inventory, suppliers, and sites.
Historical Data: It can be any past information about company’s entities which is stored and can be used to help forecast the company's future; for example, employees, operations, sales, customers, historical price, revenue growth, earnings growth.
Data warehousing is easily compatible with structured data and is being used extensively to store, transform and analyze this data as per business requirements to show results which enhance the decision making capability of organization. As mentioned earlier, spreadsheets and XML files also fall under structured data type (semi-structured data to be precise), we find a limitation posed by current data warehousing techniques as we cannot store XML files data in organized data models and need specific tools and methodologies to implement analytics to such data.

Analyzing Unstructured data

One main difference between structured and unstructured data is that former is analogous to machine-language whereas latter is for human interaction. Experts estimate that almost 80%-90% of data in organizations is unstructured data and is expected to grow to 40 zettabytes (1021) by 2020.  It can be classified in several types based on data source and each type may require different functional support and data mining techniques.
http://www.robertprimmer.com/_Media/image_med_med.png
Figure 2: Structured Vs unstructured data volume over the years
What’s striking is that that the unstructured data has a growth curve substantially greater than that of structured data. If we look out to the 2014 projections we see that, combined, the forecast is to ship 80EB of storage
Static: Scanned documents, faxes, PDF files, X-Ray and other content that is captured and managed but not subsequently modified, although it may be annotated and/or redacted if needed.
Dynamic: Authored or other content that may be created, edited, reviewed, approved by multiple people or groups. Life cycles are associated with this type of unstructured data. Document types may include policies, procedures, white papers other office documents.
E-mail, Instant Messaging: This includes e-mail and instant messaging logs. Typically, this data must be archived and, in some cases, treated as a business record.
Specialized Content: Web data is an example of unstructured data with specialized access control, content entry, rendering and other functions to manage a web site.
Social Media Content: This is a yet another very broad classification of unstructured data and it can include all the above mentioned types. Generally it consists of text, video, audio, gaming graphics, location data and so on and it contains more of rich data rather than text. It is the biggest source of data and a lot of effort is being invested globally to mine and analyze this data. With the amount of volume associated to it, it is often referred as ‘Big Data’.

The huge volume associated with unstructured data makes storage difficult but it also makes it inevitable for organizations to find means to glean information from this data. However data warehousing has not reached the sophistication level to be able to store and analyze unstructured data. Therefore, industry has turned to technological solutions to help them better manage the unstructured data. Techniques such as data mining, Natural Language Processing (NLP), text analytics, and noisy-text analytics provide different methods to find patterns in, or otherwise interpret, this information. Apart from this companies have various tools to manage this data: Big data software like Hadoop, Business intelligence software (handle structured as well as unstructured data), Document Management systems, and Search and Indexing tools.

Data Warehouse Limitations

The ultimate goal of a data warehouse system is to store historical information about a company’s transactions, and make this information easy to comprehend so that it can be used for important business decisions. However, in some business setups the need to store and operate on historical data may be limited and end user the end user may not have a strong interest in older processing data. In such scenarios cost and complexity associated with data warehousing may not bring much value to the business.
Data Flexibility remains a big hindrance as data warehouse tends to have static data with only specific number of ‘drill downs’ to specific solution. Data warehouses are usually subject to ad hoc queries and are quite difficult to tune for processing speed and query speed. The queries are limited to the initial modelling i.e. data relations are usually set when the aggregation level was defined and assembled.
It might be a tough fact to grasp but data warehousing may not be the ultimate solution to every business issue and has certain limitations when it comes to analyzing data. These limitations have been summarized in below points.
  • Data warehousing is complex to implement and needs multiple tools, and sometimes extraction, transformation and loading process may take significant time and effort which can decrease the value of produced results.
  • There is no automated way to get reports or dashboards, it involves significant effort to make data presentable.
  • Data security always remains a concern as it would depend on your cloud vendor (if used in cloud services applications) and integrity of individuals involved in analysis
  • Source system feeding the data warehouse may have hidden problems (for example incomplete information entered), and this may remain undetected for a significant time.
  • In process of data homogenization from several data sources, significant value of data might be lost.
Unstructured data is pervasive, ubiquitous, and has so many variations that it is hard to classify. Similar data may have different characteristics at different places. There is a large volume associated with it and the same type of data may be referred using different terminology by different people. This poses a biggest obstacle in implementing unstructured data in data warehouse because analytical processing requires that there must be a rationalization of terminology, or the analyst cannot recognize when the text illustrates the same thing.
Business intelligence (BI) and data warehousing suppliers have been adding support for unstructured data management to their tool sets, and some IT organizations have built their own platforms for converting unstructured data into structured records, for example, through knowledge management systems. But that can be a time-consuming and expensive process.

Future of Data Warehouse

Even with its limitations Enterprise Data Warehouse will continue to have its place in analytics but with changing time and new technologies booming the industry, its architecture and development process would need to be upgraded to match current market requirements. Big data technologies such as Map reduce, Hadoop will not replace data warehouse, and instead both technologies would run in parallel. Financial analysis and other applications associated with the data warehouse will still be important, and data warehouse itself will be a source of some of the data used in big data projects and will probably receive and store data from analysis of such projects. Few of the changes which can be anticipated in data warehouse field in coming years can be summed up as follows:
  • Real time Analytic: Enterprises will build “operational data warehouses” to combine data from multiple sources in real time and go beyond dashboards and reports to actually use their data in day-to-day operations.
  • Cloud computing which exits and is being used now, will become a requirement.
  • Architectural change to be able to process some segment of unstructured data.
  • A Big data store with ability to analyze huge volumes of data in near real time, and some mechanism to match metadata of the big data analysis to requirements of data warehouse.

Reference:

http://www.bisoftwareinsight.com/future-of-data-warehousing/

Tuesday, February 3, 2015

Business Intelligence - Did you choose the right tool?

As we move towards what is called Big data, it becomes imminent for us to foray into Analytic world to look for one best product which can cater our business needs and provide intelligence best suited to get a usable insight from the 'data junk'  that we have. I have done my own analysis of various Business Intelligence and Analytics products that we have today in the market. I have chosen 5 criteria (according to me) that would be most important for a business to look upon to finally seal the deal and chose is at our 'Go to' product.

The 5 products I have chosen are IBM Cognos, Microstrategy, SAP Business Object, Information Builders WebFocus and Tableau

Product Information:

IBM Cognos
IBM is one of the major Business Intelligence vendors in the market and provides an Enterprise Business Intelligence and very mature Analytics platform. It is designed to enable business users without technical knowledge to extract corporate data, analyze it and assemble reports. Cognos is composed of nearly three dozen software products. Because Cognos is built on open standards, the software products can be used with relational and multidimensional data sources from multiple vendors, including Microsoft, NCR Teradata, SAP and Oracle.  

IBM Cognos offers the following BI components:
  • IBM Cognos Business Intelligence
  • IBM Cognos Performance Management
  • IBM Cognos Predictive Analytics
  • IBM Cognos Dashboards, Analysis & Reports
  • IBM Cognos BI Mobile & Collaboration

Strengths
  • Analytics & statistical functionality
  • One Single Platform for dashboarding, reporting and analytics and scorecards delivered
  • Enterprise BI scalability
  • Large data volume accessed in data repositories (in the range of over 10TB)

Weaknesses:
  • Doesn’t integrate particularly well with Microsoft Office
  • No support is provided for parallel bulk data loader utilities
  • Native connectivity to different sources is limited
  • IBM is a good example of a real analytics vendor, but they provide plain reporting
  • High cost of software
  • Low Mobile BI integration

Tableau   
Tableau Software is one of the smaller Business Intelligence vendors in the market providing mainly advanced Data Discovery solutions. Tableau is not particularly sophisticated and may prove inadequate as needs mature. This has recently been addressed to some extent through an interface to R, and with this Tableau maintains ease of use as its primary focus.

Tableau Software offers the following BI components:
  • Tableau Desktop (for Anyone)
  • Tableau Server (for Organizations)
  • Tableau Digital (for Public Websites)
  • Tableau Public (for Bloggers)

Strengths
  • Speed and ease: The software is fast to install and deploy, no consultants needed. Access data from the rest of your systems quickly and easily
  • Self-Service: anyone can use Tableau, no specialists or special training required, Speed of Analysis: because visualization is at their core, people see and understand their data 10-100 times faster than usual BI reports and charts.
  • Share your graphics on the web easily
  • Data integration with multiple database sources
  • Highly cost effective, provides excellent reporting at fairly low cost

Weaknesses
  • They don’t offer production reporting.
  • There can be many single transactions to make up an enterprise deployment, so companies don’t always see Tableau as an enterprise standard even though they have thousands of users.
  • Their high ease of use makes their product less attractive to large service providers as they do not consider it industry standard tool
SAP BusinessObjects:
SAP BusinessObjects BI is SAP’s Business Intelligence tool, which is a suite of front-end applications that allow business users to view, sort and analyze business intelligence data.

The suite includes the following key applications:
  • Crystal Reports -Enables users to design and generate reports
  • Xcelsius/Dashboards -Allows users to create interactive dashboards
  • Web Intelligence - Provides a self-service environment for creating ad hoc queries and analysis of data both online and offline
  • Explorer - Allows users to search through BI data sources using an iTunes-like interface. Users do not have to create queries to search the data and results are shown with a chart that indicates the best information match.

Strengths
  • Complete suite of solutions for Data Management, Query Reporting, OLAP Analysis and dashboarding.
  • Provide a set of Analytical Applications via third parties.
  • Very user friendly User Interface; the product is easy to learn and use.
  • Mature system administration and metadata management.

Weaknesses
  • Due to the fact that multiple techniques are delivered to support the user to access BI content, not all of the components are completely interchangeable.
  • Different designer environments due to different content architectures combined in a single platform.
  • Provides fairly plan analytics compared to the cost associated and therefore provides low value to consumer

MicroStrategy    MicroStrategy is one of the major Business Intelligence vendors in the market providing a complete Enterprise Business Intelligence platform. It takes positives from both old and new business intelligence. It is truly an enterprise solution meeting the demands for regular reporting, complex dashboards and extensive admin, while offering self-service for BI users. It is expensive for organizations with less demanding requirements.
MicroStrategy offers the following BI components:
  • Agile Analytics
  • Scorecards and Dashboards
  • Enterprise Reporting
  • Advanced and Predictive Analytics
  • High Performance BI
  • Big Data

Strengths
  • Ability to analyze and visualize the largest data volumes
  • Rapidly build Information-driven Mobile Apps, one of the leaders in Mobile BI solutions
  • Integrates well Microsoft office, multiple databases and low administration complexity
  • Deploy quickly via the cloud; including hybrid and flexible versions of cloud / on-premise deployments
  • Highly user friendly user interface, provides excellent data visualization and reporting functionality
  • Low cost, high performance, and high sales associated to it, and thus provides high value to customers

Weaknesses
  • Does not provide full data warehousing stack capabilities such as data movement
  • Lack of fully configured application packages (except via partners)
  • Various piece functionality (i.e. mobile solution, visualization tool etc.) inherit all MicroStrategy platform   capabilities so are dependent on the platform for deployment.

Information Builders 
Information Builders' WebFOCUS BI and analytics platform offers a broad range of analytics capabilities with data integration and application support. It is particularly well suited to operational reporting and dashboards, and to building Web-based analytic applications that require low latency and multiple data sources with production-level scalability in environments without a data warehouse. 

Strengths:
  • Fully-customized reports with guided ad hoc technology by simply choosing columns, sort criteria, measures, and output formats from drop-down menus.
  • Robust report delivery engine with leading-edge event monitoring, provides a single point of control for automation, scheduling, and storage of reports and other critical business content.
  • Its most notable features is its "non-persistence," or its ability to run without server power when not accessing or processing data. This means that much less hardware is required.
  • Multiple functionalities available to integrate with mobile apps and devices
  • Cost effective as software cost is low compared to other products

Weaknesses:
  • Its developer interface has been criticized for being less user friendly as it runs with a scripting interface instead of a more user-friendly IDE.
  • It lacks a widely adopted data discovery offering, this limits its broader use and the platform's adoption for more complex types of analysis
  • Dashboarding and reporting functionality outside its core WebFOCUS and iWay platforms is strictly limited

Criteria for Comparison

Mobile BI: It is the ability of the product to develop and deliver content to mobile devices in a publishing and/or interactive mode. A top rated product is one which takes maximum advantage of mobile devices' native capabilities, such as touchscreen, camera, location awareness and natural-language query to deliver the end product.
With new advancements in Mobile technology, more customers now want integrated BI solutions for their mobile devices.

Data integration: BI tool should be able to take data input from a vast number of databases and data sources. Data integration also includes the how well the products integrates with other similar products and Microsoft office.
It greatly affects other factors such as ease of use and value, therefore this criteria has received second highest weightage (20%)
 
Metadata management: A product which tops the list should provide a robust and centralized way for administrators to search, capture, store, reuse and publish metadata objects, such as dimensions, hierarchies, measures, performance metrics/key performance indicators (KPIs), and report layout objects, parameters and so on. Administrators should have the ability to promote a business-user-defined data model.
This is the indicator of performance and strength of the analytic tool therefore it has received third highest weightage (15%).

Dashboard, Reporting & Online analytical processing (OLAP): Providing the ability to create highly formatted, print-ready and interactive reports, with or without parameters. Dashboards should allow publishing multi-object, linked reports and parameters with intuitive and interactive displays; user should be able to benefit from visualization components such as gauges, sliders, checkboxes and maps. OLAP is the ability of the tool to allow users to analyze data with fast query and calculation performance, enabling ‘slicing and dicing’ style of analysis. Allowing users to navigate multidimensional drill paths, write-back values to a database for planning and "what if?" modelling.
This is one of the main criteria while choosing a Business Intelligence product and therefore it has the highest weightage (25%).

Ease of Use: This assesses how easily a customer with just basic computer knowledge can understand and use the application, and can understand the data with tool’s data visualization capability.

Value: It is the likely benefits versus the cost. It is one of the main criteria when it comes to choosing product when there is some tough competition between vendors and for this reason it has second highest weightage (20%).

Comparison Table

This table shows comparison of the products on the basis of strengths and weaknesses mentioned for each products. Products have been scored at the scale of 5 (5 being the highest)


Weightage
MicroStrategy
IBM Cognos
Tableau
Information Builders
SAP Business Object
Mobile BI
10
 5
 1
 2
 4
 3
Data integration
20
 5
 1
 4
 2
 3
Metadata management 
15
 5
 4
 1
 2
 3
Dashboard, reporting & Online analytical processing (OLAP) 
25
 4
 3
 5
 2
 1
Ease of Use
10
 3
 2
 5
 1
 4
Value
20
4
 2
3
5
 1
Total
100
4.35
2.25
3.5
2.7
2.2
Rank

1
4
2
3
5

Summary:
Microstrategy leads in almost every criteria and for this reason is ranked number 1.
Tableau ranks 2nd and lacks mostly because its focus is more on simplicity rather than proving itself as an enterprise standard product. However it really lacks in metadata management and does not provide production reporting. It is still the best option for small business owing to its speed, ease of use and low cost.
Information Builder comes out as one of the leaders in Mobile BI and cost-benefit analysis. However its complex scripted user interface, and less adaptive reporting, analytical and data integration capabilities make it good fit for requirements where minimal reporting features are required. Overall considering its value for money makes it ranks 3rd in the list
IBM Cognos provides strong dashboard & reporting functionality and metadata management, however it can really improve on rest of the parameters, specially its complex usability. It also has high cost associated with its use. Thus it ranks 4th.
SAP BusinessObjects’ key features are its ease of use, data integration and new metadata management module.  It falls short on customer expectation in the value it provides, due to poor analytical capabilities and not so cheap software, and thus it ranks 5 in this comparison.                   

References: